Sherley Project — Grant Figures

Author

Tianqi Ouyang

Published

September 8, 2026

1 Setup

Grant-figure versions of the Carboplatin Cohort analyses, re-expressed on the eGFR difference scale.

\[ \text{eGFR difference (\%)} \;=\; \frac{\text{eGFR}_{\text{CR-CYS}} - \text{CrCl}_{\text{CG}}}{\text{CrCl}_{\text{CG}}} \times 100 \]

Both terms in the numerator are in mL/min: the CKD-EPI creatinine–cystatin C eGFR is the version adjusted for actual body surface area (ckd_epi_gfr_cre_cys_unindex, mL/min — not the 1.73 m²-indexed ckd_epi_gfr_cre_cys), matching the units of Cockcroft-Gault creatinine clearance. The result is expressed as a percentage: 0 % means the two estimators agree, +20 % means CKD-EPI Cr-Cys is 20 % higher than Cockcroft-Gault, −20 % means 20 % lower.

NoteRelationship to the eGFR ratio used on the Carboplatin page

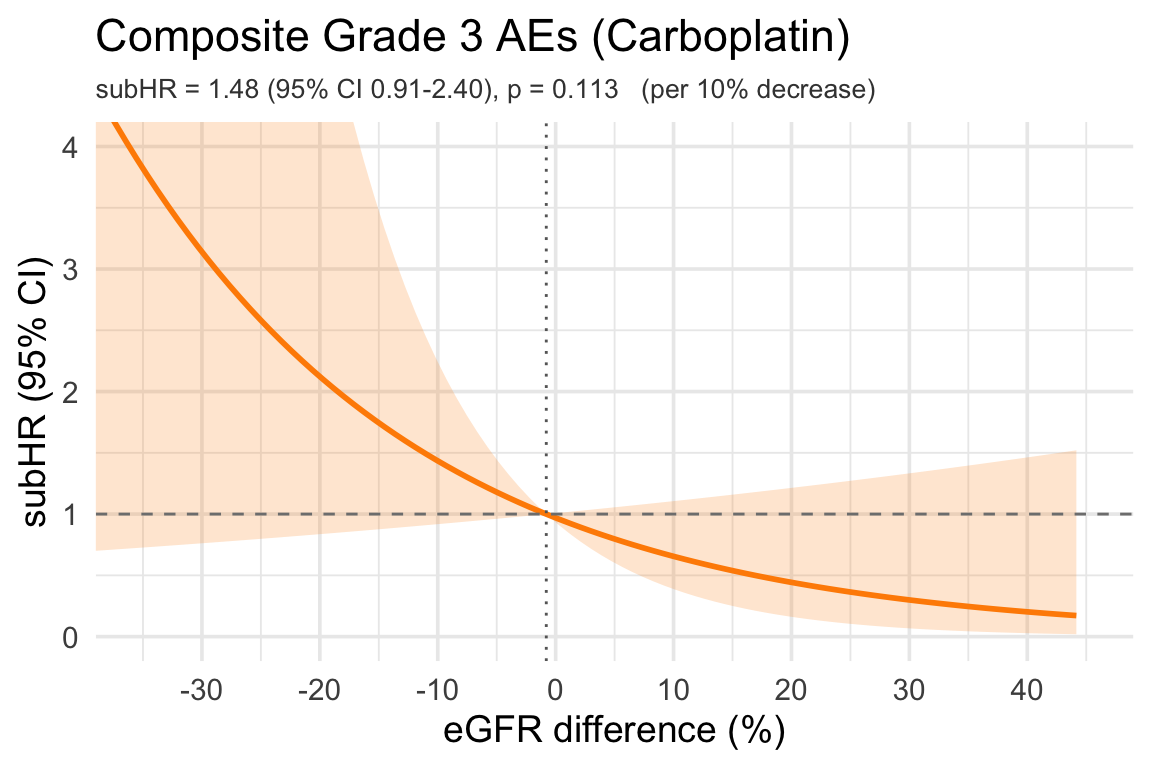
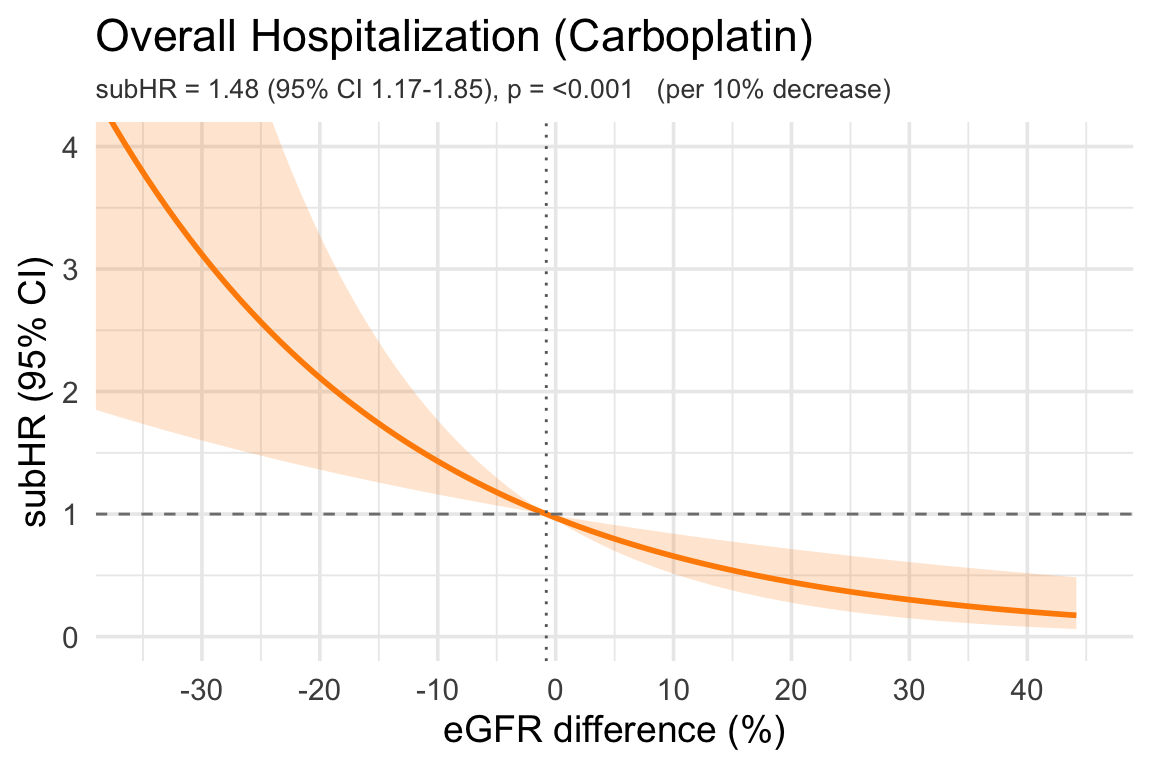
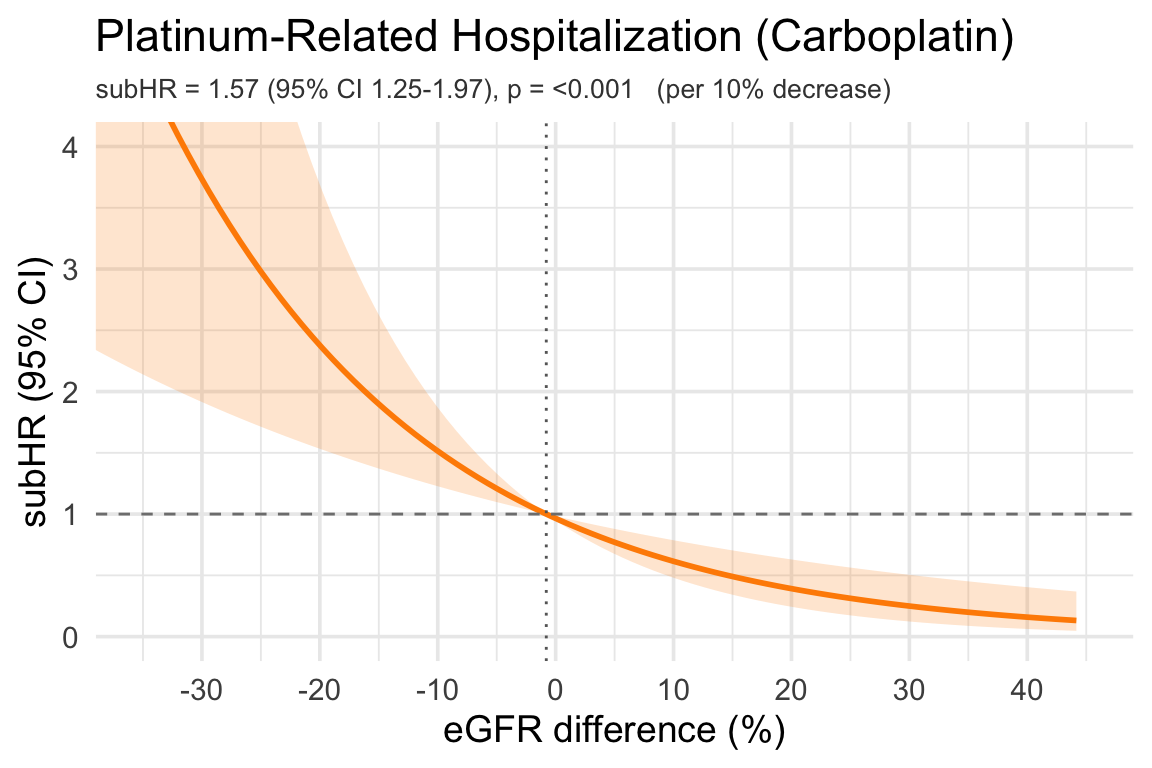
Because egfr_difference = 100 × ((eGFR − CG) / CG) = 100 × (egfr_ratio − 1), this is a pure re-centring and rescaling of the eGFR ratio: the reference point moves from 1 to 0 %. The underlying Fine-Gray fits are therefore the same models as §9 of the Sherley project’s Carboplatin Cohort page — identical p-values. The reported subHRs differ only because this page reports them per 10 % decrease in eGFR difference, whereas §9 reports per 0.1-unit increase in the ratio; the two are reciprocals of each other.

Code
# Force UTF-8 locale so captions and other strings render real Unicode
# (e.g. em-dash) instead of <U+2014> escape sequences.
invisible(Sys.setlocale("LC_ALL", "en_US.UTF-8"))
library(tidyverse)
library(scales)
library(ggplot2)
library(tidycmprsk)
library(ggsurvfit)
library(gtsummary)
library(officer)
library(rvg)

# Output directory for downloadable PowerPoint plots (plots/grant/<name>.pptx).
pptx_dir <- normalizePath("docs/plots/grant", winslash = "/", mustWork = FALSE)
dir.create(pptx_dir, recursive = TRUE, showWarnings = FALSE)

# Save the given ggplot as an editable PowerPoint slide via rvg::dml, named by
# the calling chunk's label. Mirrors the helper in the Sherley project's
# sherley_carbo.qmd; the
# post-render script scripts/inject_pptx_links.py then injects a per-plot
# download link beneath each figure in the rendered HTML.
.save_plot_pptx <- function(p, name = NULL) {
  if (is.null(p) || !inherits(p, "ggplot")) return(invisible(NULL))
  if (is.null(name)) {
    name <- tryCatch(knitr::opts_current$get("label"), error = function(e) NULL)
  }
  if (is.null(name)) return(invisible(NULL))
  safe <- gsub("[^A-Za-z0-9]+", "_", name)
  out  <- file.path(pptx_dir, paste0(safe, ".pptx"))
  ok <- tryCatch({
    pp <- officer::read_pptx()
    pp <- officer::add_slide(pp, layout = "Title and Content", master = "Office Theme")
    pp <- officer::ph_with(
      pp,
      value = rvg::dml(ggobj = p),
      location = officer::ph_location_type(type = "body")
    )
    print(pp, target = out)
    TRUE
  }, error = function(e) FALSE)
  invisible(if (ok) paste0("plots/grant/", safe, ".pptx") else NULL)
}

# Format the exposure-effect subtitle: subHR (or HR) per `scale` units with
# 95% Wald CI and p-value, extracted from the Fine-Gray / Cox PH fit.
.hr_subtitle <- function(beta, V_beta, scale = 1,
                         hr_type = "subHR",
                         unit_label = "per 1-unit increase") {
  se   <- sqrt(V_beta)
  hr   <- exp(beta * scale)
  b1   <- exp((beta - 1.96 * se) * scale)
  b2   <- exp((beta + 1.96 * se) * scale)
  # A negative `scale` (reporting per unit DECREASE) reverses the bound order,
  # so sort rather than assuming b1 <= b2.
  lcl  <- min(b1, b2)
  ucl  <- max(b1, b2)
  pval <- 2 * (1 - pnorm(abs(beta / se)))
  p_str <- ifelse(pval < 0.001, "<0.001", sprintf("%.3f", pval))
  sprintf("%s = %.2f (95%% CI %.2f-%.2f), p = %s   (%s)",
          hr_type, hr, lcl, ucl, p_str, unit_label)
}

# Placeholder for outcomes whose design matrix is singular on this sub-cohort.
.plot_failed <- function(label = "Model could not be fit") {
  p <- ggplot() +
    annotate("text", x = 0.5, y = 0.5,
             label = paste0(label, "\n(singular design — cohort too small)"),
             size = 3.5) +
    coord_cartesian(xlim = c(0, 1), ylim = c(0, 1)) +
    theme_void()
  .save_plot_pptx(p)
  p
}

# Analysis data is produced by the Sherley project's data pipeline
# (Sherley/qmd/sherley_data.qmd writes this file). Load the whole cohort, then
# keep only carboplatin patients.
sherley_rds <- "/Users/to909/Desktop/Meg/Sherley/sherley_final_master.rds"
dat <- readRDS(sherley_rds) %>%
  filter(platin_group == "Carboplatin")

dat <- dat %>%
  mutate(
    # BSA-adjusted CKD-EPI Cr-Cys (mL/min) vs Cockcroft-Gault CrCl (mL/min).
    # Relative difference expressed as a PERCENT; 0 % = the two estimators agree.
    egfr_difference = 100 * (ckd_epi_gfr_cre_cys_unindex - cockcroft) / cockcroft,
    # Binary exposures for the adjusted CIF sections (§6, §7.3). dose_diff_pct
    # comes from the data pipeline:
    #   100 * (carbo_dose_redcap - carbo_dose_cre_cys) / carbo_dose_cre_cys
    egfr_diff_lt_neg10 = as.integer(egfr_difference < -10),
    dose_pct_ge10      = as.integer(dose_diff_pct >= 10)
  )

cat("Carboplatin cohort N =", nrow(dat), "\n")
Carboplatin cohort N = 121 
Code
cat("eGFR difference available for N =", sum(!is.na(dat$egfr_difference)), "\n")
eGFR difference available for N = 121 

2 Carboplatin Dose Administered

Actual carboplatin dose administered (REDCap field carbo_dose_redcap, mg) across the 121-patient carboplatin cohort. All 121 have a thoracic primary and every patient has a recorded dose, so the denominator is the full cohort.

Code
dose_vals <- dat$carbo_dose_redcap
dose_vals <- dose_vals[!is.na(dose_vals)]

tibble::tibble(
  Statistic = c("N with a recorded dose", "Mean (SD)", "Median (IQR)",
                "Range (min – max)"),
  Value = c(
    as.character(length(dose_vals)),
    sprintf("%.1f (%.1f) mg", mean(dose_vals), sd(dose_vals)),
    sprintf("%.1f (%.1f, %.1f) mg", median(dose_vals),
            quantile(dose_vals, 0.25), quantile(dose_vals, 0.75)),
    sprintf("%.1f – %.1f mg", min(dose_vals), max(dose_vals))
  )
) %>%
  knitr::kable(align = c("l", "r"),
               caption = "Actual carboplatin dose administered (mg), carboplatin cohort.")
Actual carboplatin dose administered (mg), carboplatin cohort.
Statistic Value
N with a recorded dose 121
Mean (SD) 503.4 (124.6) mg
Median (IQR) 506.0 (407.5, 590.5) mg
Range (min – max) 197.4 – 750.0 mg

3 eGFR Difference Distribution (Carboplatin)

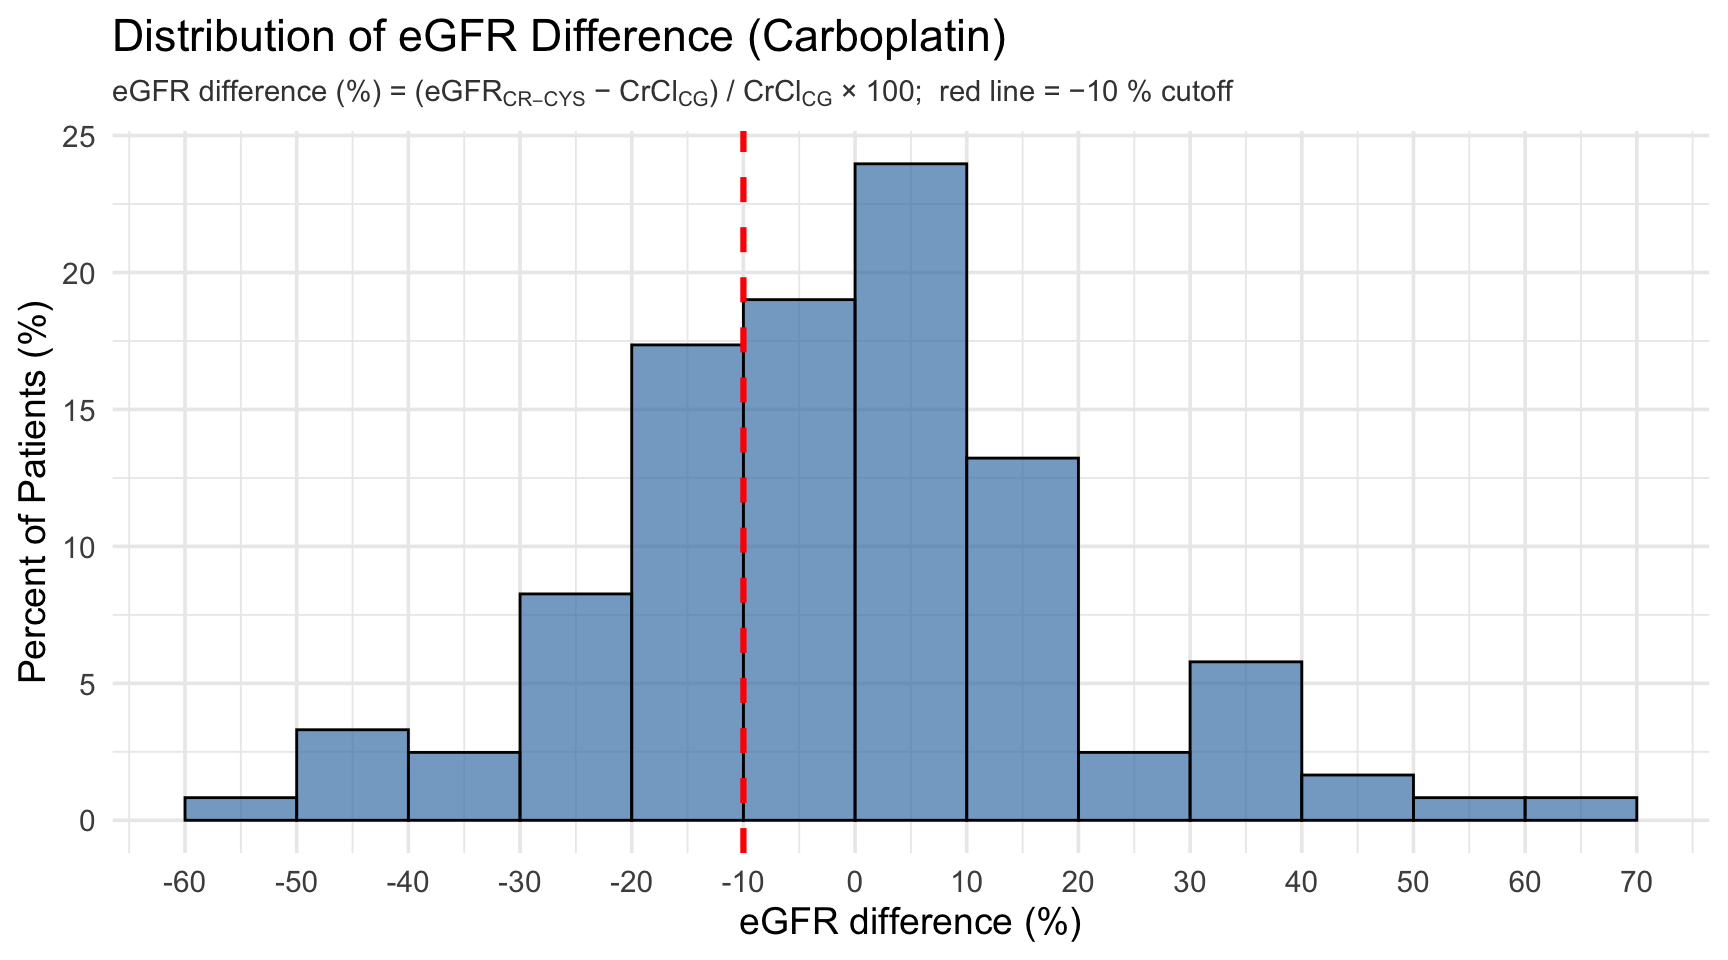
Mirrors §4 of the Sherley Carboplatin Cohort page, re-expressed as a percentage. Bins are 10 % wide with an axis tick at every bin edge. The red dashed line marks −10 % — the randomization cutoff.

Code
diff_hist <- dat %>% filter(!is.na(egfr_difference))

ggplot(diff_hist, aes(x = egfr_difference)) +
  geom_histogram(aes(y = after_stat(count) / sum(after_stat(count)) * 100),
                 binwidth = 10, boundary = 0,
                 fill = "steelblue", color = "black", alpha = 0.7) +
  geom_vline(xintercept = -10, linetype = "dashed", color = "red",
             linewidth = 1.1) +
  labs(title = "Distribution of eGFR Difference (Carboplatin)",
       subtitle = expression(paste("eGFR difference (%) = (eGFR"[CR-CYS],
                                   " − CrCl"[CG], ") / CrCl"[CG], " × 100;  red line = −10 % cutoff")),
       x = "eGFR difference (%)",
       y = "Percent of Patients (%)") +
  scale_x_continuous(breaks = seq(-100, 200, 10)) +
  theme_minimal(base_size = 14) +
  theme(plot.subtitle = element_text(size = 11, color = "grey25")) -> p
.save_plot_pptx(p)
p
Code
q <- quantile(diff_hist$egfr_difference, c(0.025, 0.25, 0.5, 0.75, 0.975),
              na.rm = TRUE)
tibble::tibble(
  Statistic = c("N", "Median", "IQR (p25, p75)", "2.5th pct", "97.5th pct",
                "% with eGFR Cr-Cys below CG (difference < 0 %)",
                "% at or below the −10 % randomization cutoff"),
  Value = c(
    as.character(nrow(diff_hist)),
    sprintf("%.1f%%", q[["50%"]]),
    sprintf("%.1f%%, %.1f%%", q[["25%"]], q[["75%"]]),
    sprintf("%.1f%%", q[["2.5%"]]),
    sprintf("%.1f%%", q[["97.5%"]]),
    sprintf("%.1f%%", 100 * mean(diff_hist$egfr_difference < 0)),
    sprintf("%.1f%% (n = %d)",
            100 * mean(diff_hist$egfr_difference <= -10),
            sum(diff_hist$egfr_difference <= -10))
  )
) %>%
  knitr::kable(align = c("l", "r"),
               caption = "eGFR difference (%) — distribution summary (carboplatin cohort).")
eGFR difference (%) — distribution summary (carboplatin cohort).
Statistic Value
N 121
Median -0.8%
IQR (p25, p75) -14.3%, 9.7%
2.5th pct -42.6%
97.5th pct 44.2%
% with eGFR Cr-Cys below CG (difference < 0 %) 51.2%
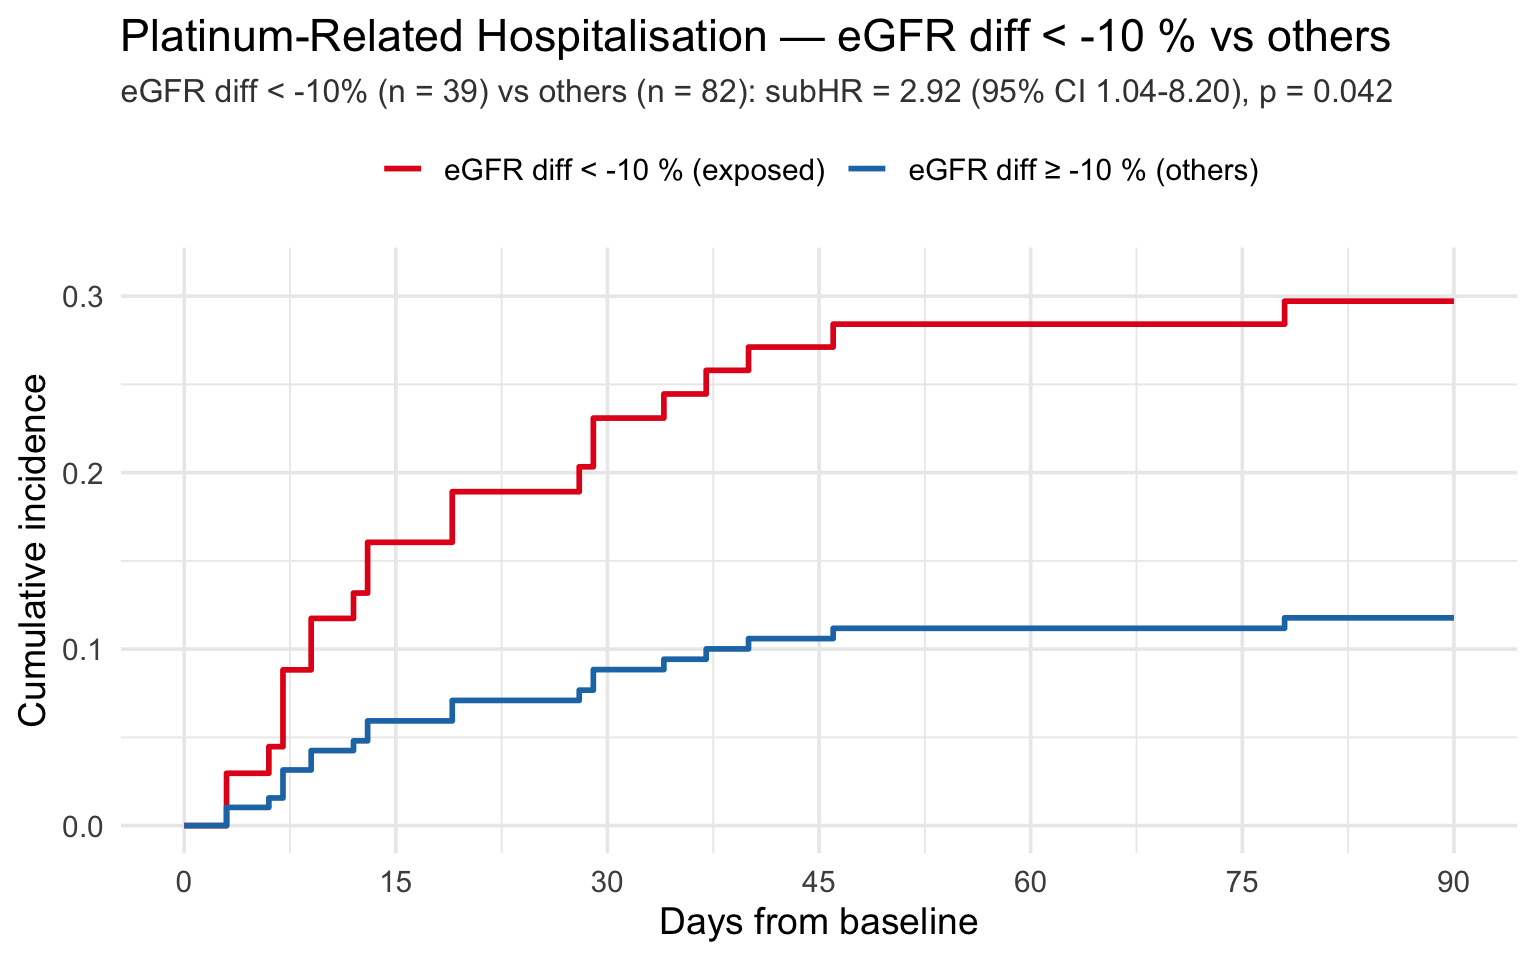
% at or below the −10 % randomization cutoff 32.2% (n = 39)

4 Predicted Dosing in the eGFR Difference ≤ −10 % Subgroup

The patients who would meet the −10 % randomization cutoff — those whose BSA-adjusted CKD-EPI Cr-Cys eGFR sits at least 10 % below their Cockcroft-Gault creatinine clearance. For this subgroup the table contrasts the carboplatin dose the Calvert formula would have produced from each kidney-function estimator against the dose actually given.

Predicted doses use Calvert at the patient’s own target AUC: dose = AUC × (min(eGFR, 125) + 25). Both arms cap the filtration estimate at 125 mL/min, so the comparison is symmetric — carbo_dose_cre_cys from the data pipeline already applies the cap (verified: it reproduces the capped formula exactly, and differs from the uncapped one by up to 53 mg), and the Cockcroft-Gault arm applies the same min(CG, 125).

The cap binds more often on the Cockcroft-Gault side in this subgroup — 11 of 39 patients exceed 125 mL/min by CG versus 3 of 39 by CKD-EPI Cr-Cys — which is expected, since the subgroup is selected for CG running high relative to Cr-Cys. The cap is therefore doing real work here: without it the Cr-Cys − CG dose gap would widen from −75.1 (41.1) mg to −113.2 (87.4) mg.

Code
sub10 <- dat %>%
  filter(!is.na(egfr_difference), egfr_difference <= -10) %>%
  mutate(carbo_dose_cg = carbo_AUC * (pmin(cockcroft, 125) + 25))

# mean (SD) and median (IQR) for one column, formatted to 1 dp.
.msd <- function(x) {
  x <- x[!is.na(x)]
  c(sprintf("%.1f (%.1f)", mean(x), stats::sd(x)),
    sprintf("%.1f (%.1f, %.1f)", stats::median(x),
            stats::quantile(x, .25), stats::quantile(x, .75)))
}

.rows <- list(
  list("Predicted dose — CKD-EPI Cr-Cys (mg)",  sub10$carbo_dose_cre_cys),
  list("Predicted dose — Cockcroft-Gault (mg)", sub10$carbo_dose_cg),
  list("Actual dose administered (mg)",         sub10$carbo_dose_redcap),
  list("Difference — Cr-Cys − Cockcroft-Gault (mg)",
       sub10$carbo_dose_cre_cys - sub10$carbo_dose_cg),
  list("Difference — Cr-Cys − actual dose (mg)",
       sub10$carbo_dose_cre_cys - sub10$carbo_dose_redcap)
)

purrr::map_dfr(.rows, function(r) {
  v <- .msd(r[[2]])
  tibble::tibble(Measure = r[[1]], `Mean (SD)` = v[1], `Median (IQR)` = v[2])
}) %>%
  knitr::kable(
    align = c("l", "r", "r"),
    caption = sprintf(
      "Carboplatin dosing among patients with eGFR difference ≤ −10 %% (n = %d of %d carboplatin patients, %.1f %%). Negative differences mean the CKD-EPI Cr-Cys equation would have dosed lower.",
      nrow(sub10), nrow(dat), 100 * nrow(sub10) / nrow(dat)))
Carboplatin dosing among patients with eGFR difference ≤ −10 % (n = 39 of 121 carboplatin patients, 32.2 %). Negative differences mean the CKD-EPI Cr-Cys equation would have dosed lower.
Measure Mean (SD) Median (IQR)
Predicted dose — CKD-EPI Cr-Cys (mg) 472.0 (135.7) 476.0 (362.1, 562.7)
Predicted dose — Cockcroft-Gault (mg) 547.1 (137.1) 599.6 (427.3, 634.7)
Actual dose administered (mg) 549.8 (136.7) 600.0 (414.0, 629.5)
Difference — Cr-Cys − Cockcroft-Gault (mg) -75.1 (41.1) -62.1 (-96.7, -52.5)
Difference — Cr-Cys − actual dose (mg) -77.8 (43.2) -72.5 (-102.8, -53.0)

5 Linear subHR Curves — eGFR Difference (Carboplatin)

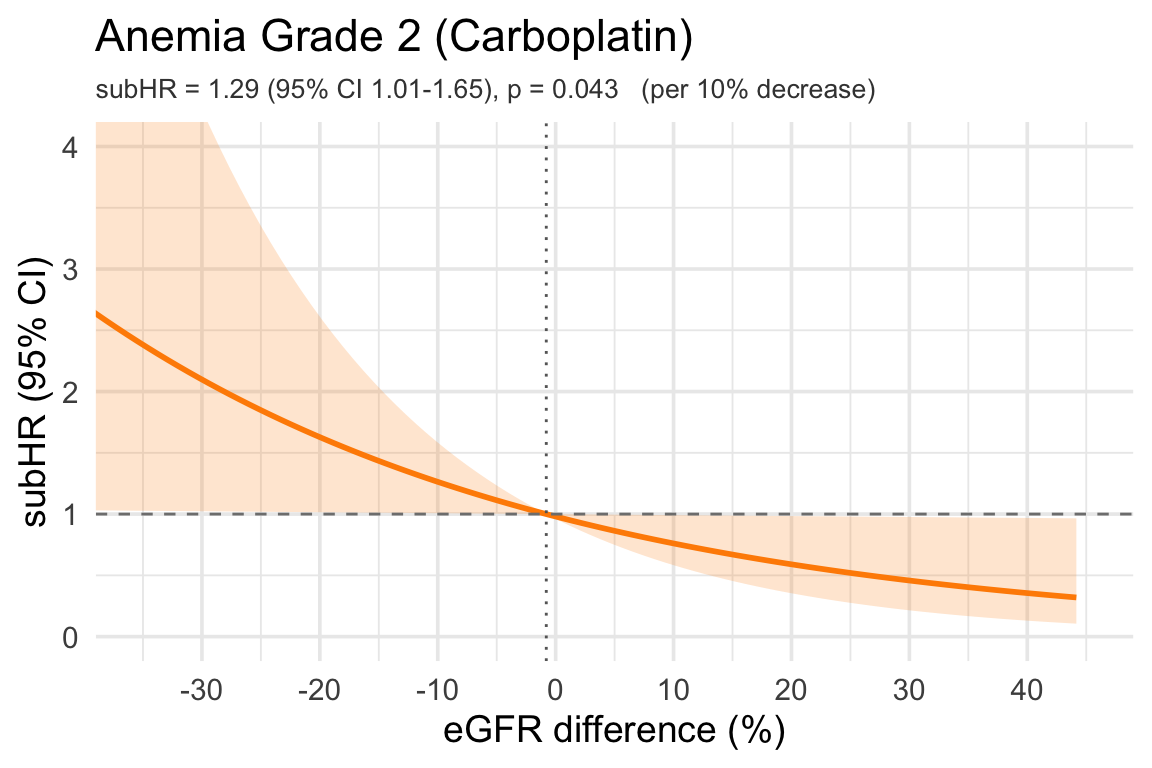
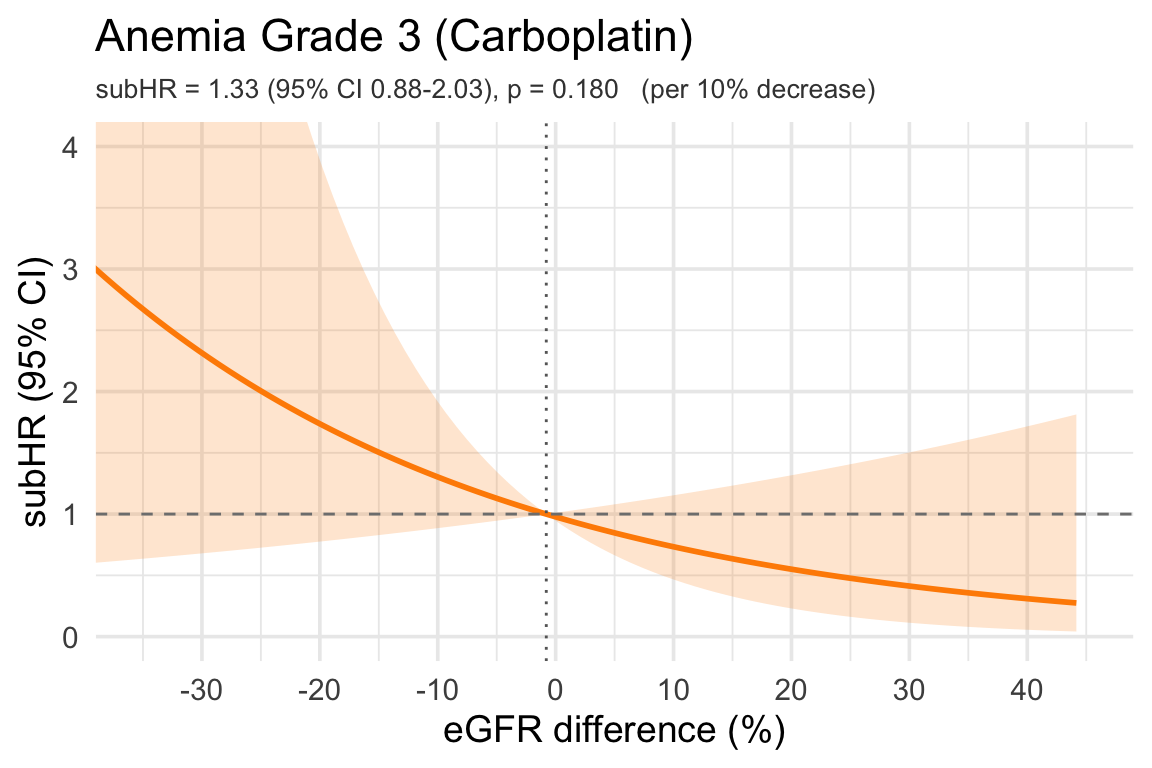
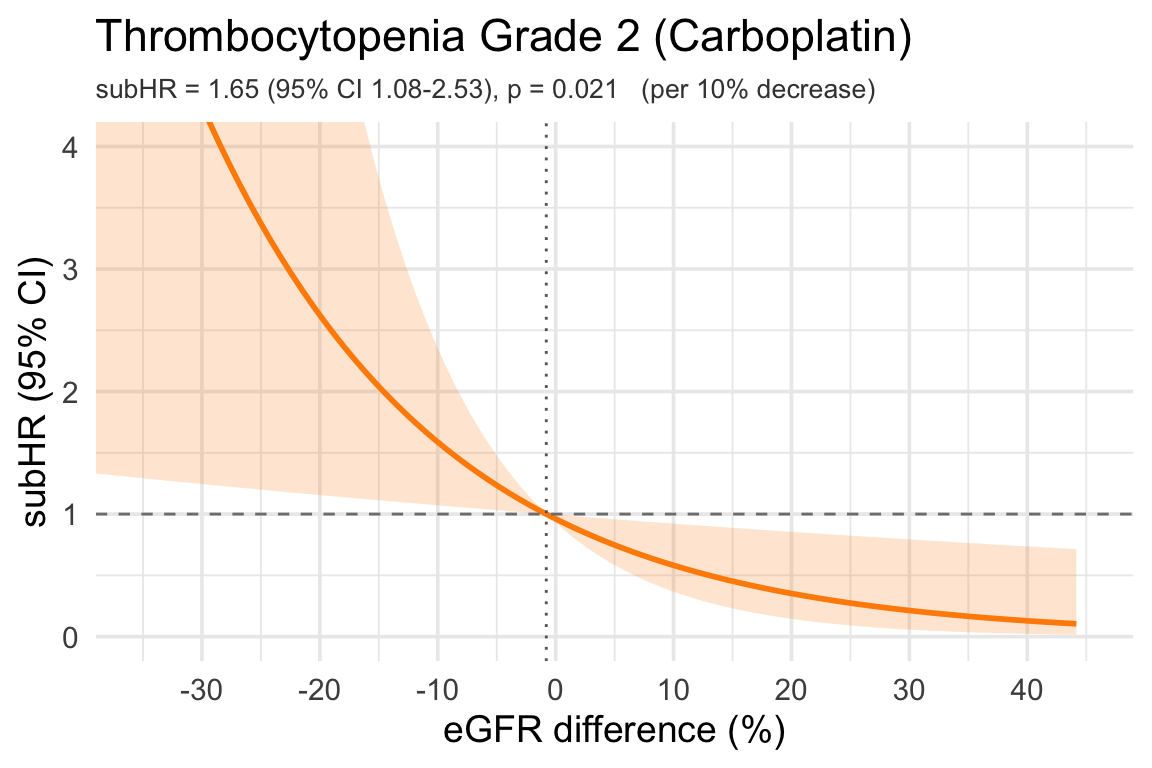
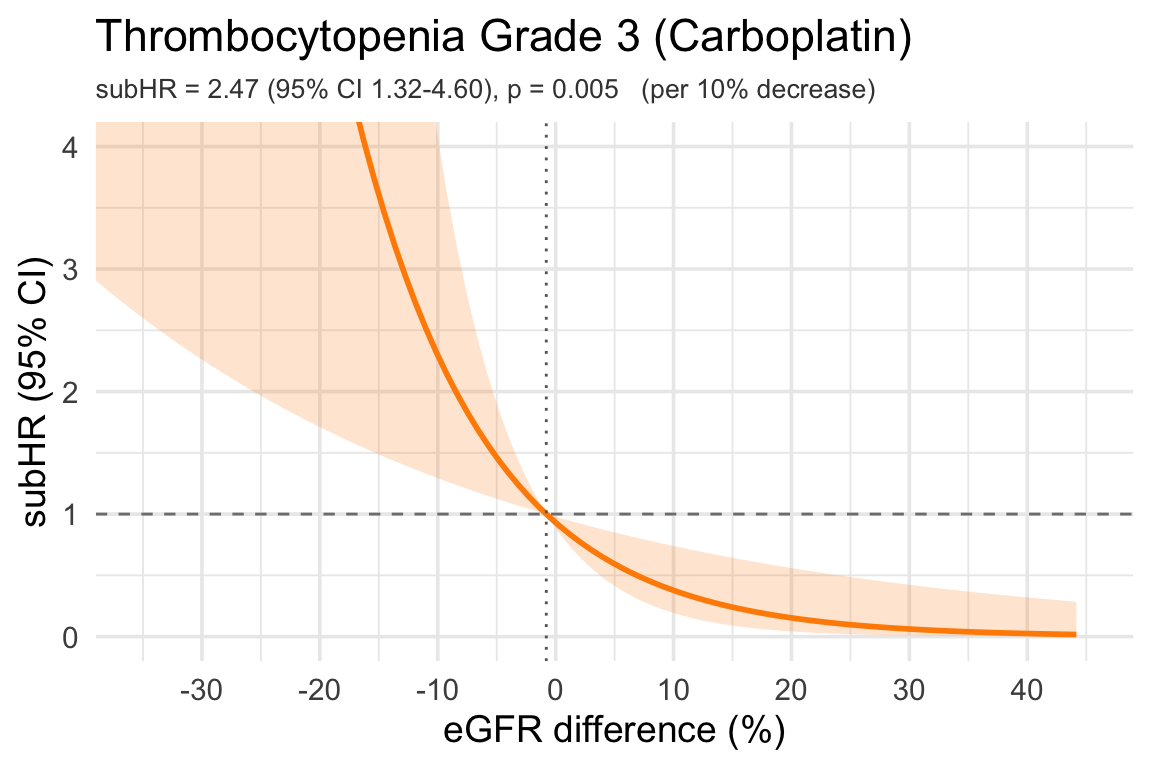
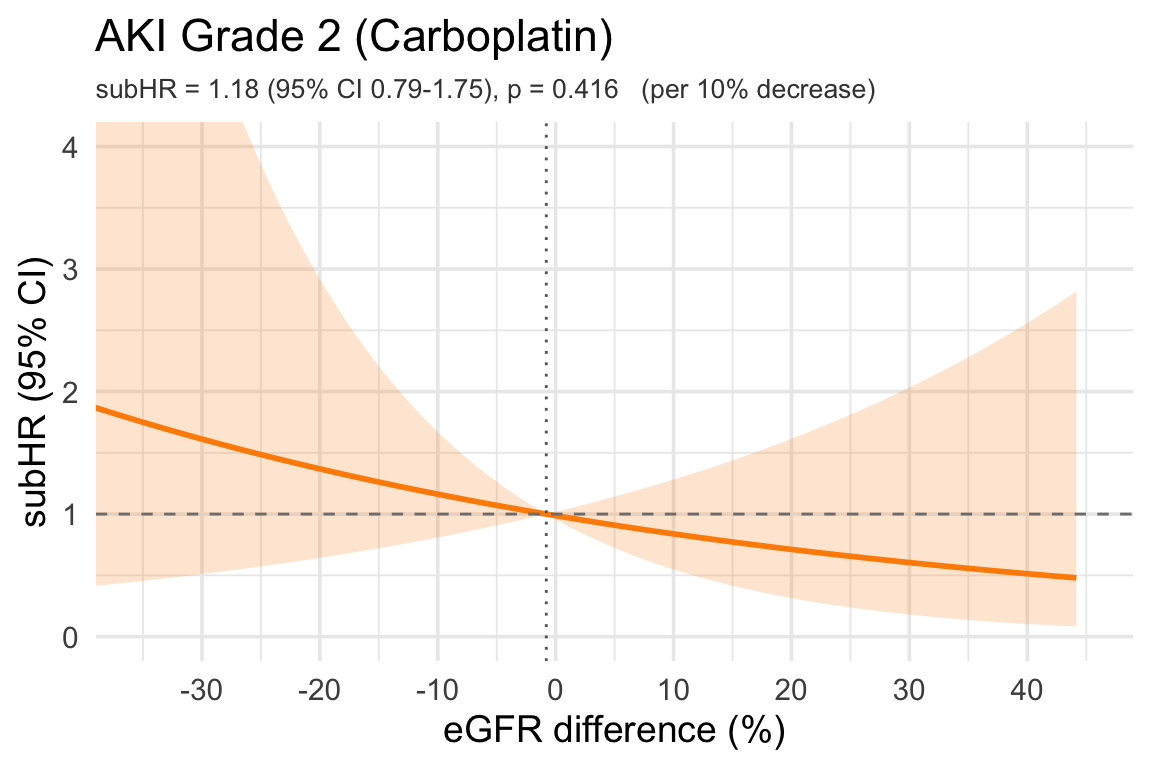
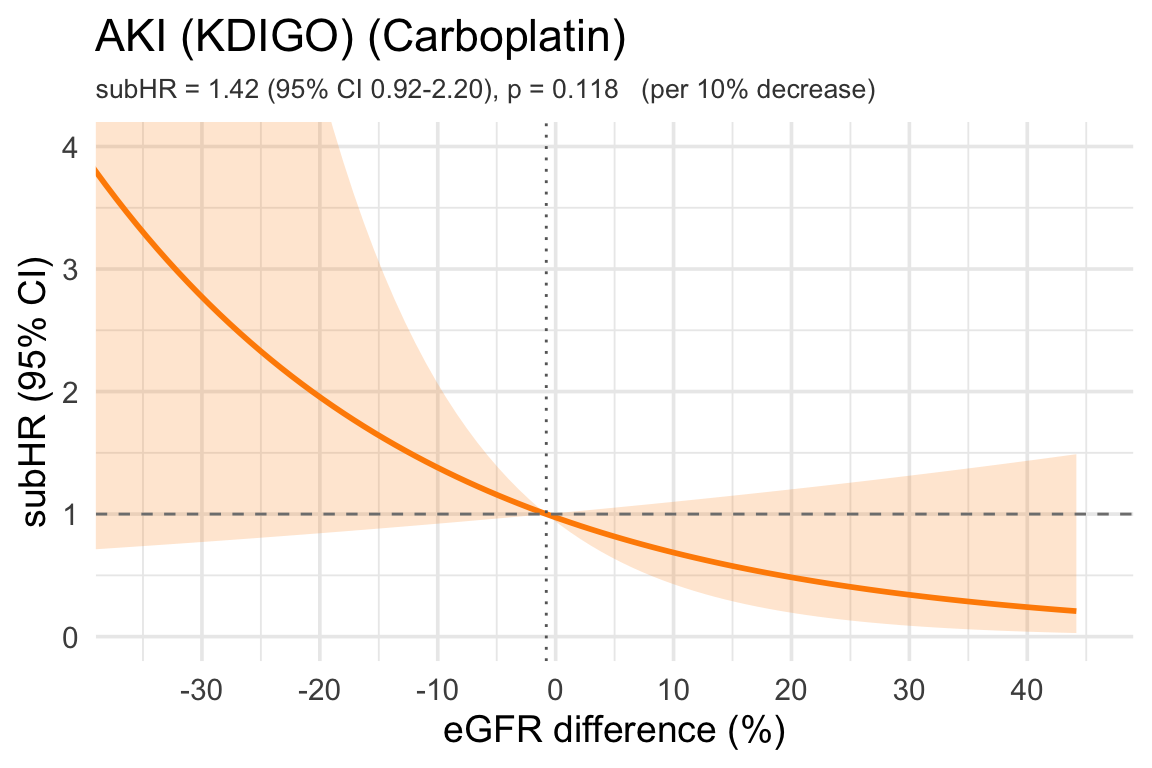
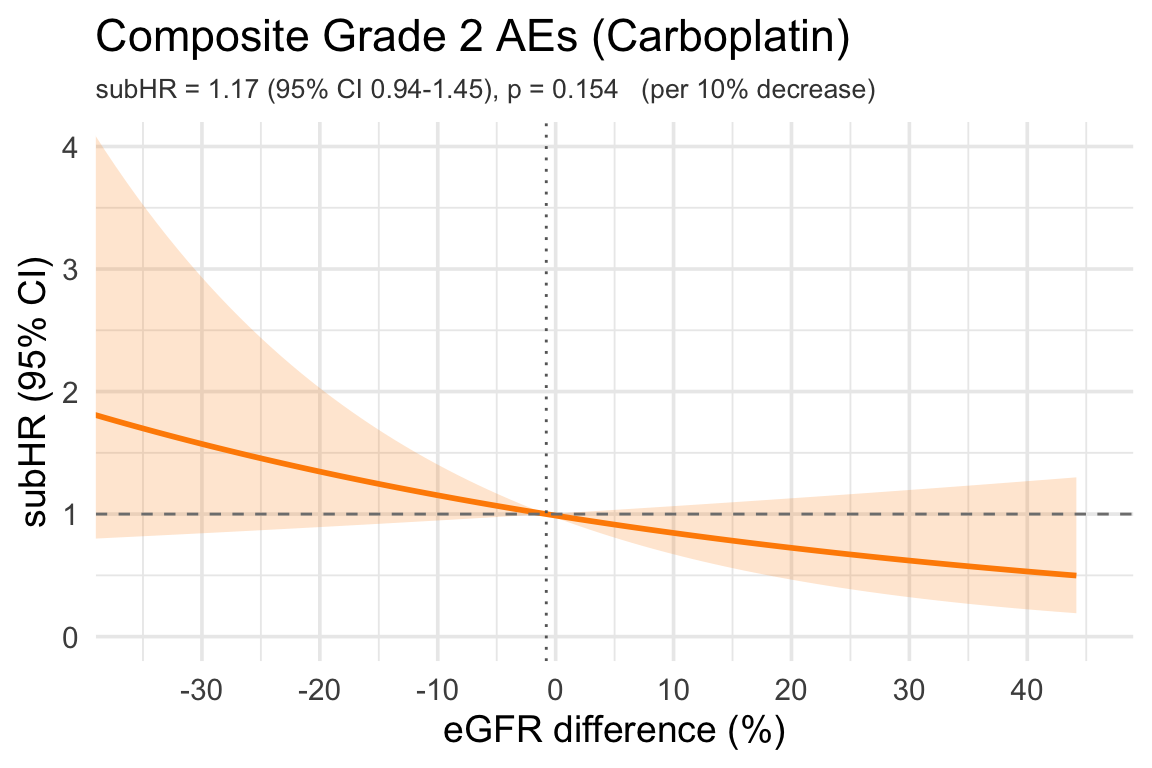
Mirrors §9.1–9.10 of the Sherley Carboplatin Cohort page, with the exposure re-expressed as the eGFR difference in percent (ticks every 10 %). Each curve is the adjusted Fine-Gray subdistribution hazard ratio as a smooth linear function of the eGFR difference, plotted relative to the cohort median (dotted vertical line). The dashed horizontal line marks subHR = 1. Reported subHRs are per 10 % decrease in eGFR difference, so a subHR above 1 means a larger CKD-EPI-Cr-Cys shortfall relative to Cockcroft-Gault carries higher risk. Models adjust for age, sex, ECOG score, ICI use and Cockcroft-Gault CrCl, plus baseline haemoglobin (anemia), baseline platelets (thrombocytopenia) or both (composite cytopenia outcomes).

Code
# Defaults give the eGFR-difference curves of this section; §7.2 reuses the
# helper for the percent dose discrepancy via x_var / scale / labels / xlim.
plot_subhr_linear_diff <- function(time_var, status_var, extra_adj = NULL,
                                   outcome_label,
                                   x_var = "egfr_difference", scale = -10,
                                   unit_label = "per 10% decrease",
                                   x_lab = "eGFR difference (%)",
                                   xlim = c(-35, 45)) {
  base_adj <- c("age", "sex", "ecog_score", "ici", "cockcroft")
  keep <- c(x_var, time_var, status_var, base_adj, extra_adj)
  d <- dat %>% dplyr::select(all_of(keep)) %>% tidyr::drop_na()

  adj_df <- d[, c(base_adj, extra_adj), drop = FALSE]
  X_adj <- model.matrix(~ ., data = adj_df)[, -1, drop = FALSE]
  X <- cbind(d[[x_var]], X_adj)
  colnames(X)[1] <- x_var

  stat_num <- suppressWarnings(as.integer(as.character(d[[status_var]])))
  time_num <- as.numeric(d[[time_var]])

  fit <- tryCatch(
    cmprsk::crr(ftime = time_num, fstatus = stat_num,
                cov1 = X, failcode = 1),
    error = function(e) NULL
  )
  if (is.null(fit)) return(.plot_failed(outcome_label))

  beta   <- fit$coef[1]
  V_beta <- fit$var[1, 1]
  # x_var is in percentage points, so beta is per 1 pp. scale = -10 reports per
  # 10 % DECREASE, +10 per 10 % increase (sign handled in .hr_subtitle).
  subtitle_str <- .hr_subtitle(beta, V_beta, scale = scale,
                               hr_type = "subHR",
                               unit_label = unit_label)

  ref_x  <- median(d[[x_var]], na.rm = TRUE)
  grid_x <- seq(quantile(d[[x_var]], 0.025, na.rm = TRUE),
                quantile(d[[x_var]], 0.975, na.rm = TRUE),
                length.out = 100)

  log_hr <- beta * (grid_x - ref_x)
  se     <- sqrt((grid_x - ref_x)^2 * V_beta)

  df_plot <- tibble(
    x     = grid_x,
    subhr = exp(log_hr),
    lcl   = exp(log_hr - 1.96 * se),
    ucl   = exp(log_hr + 1.96 * se)
  )

  ggplot(df_plot, aes(x = x, y = subhr)) +
    geom_ribbon(aes(ymin = lcl, ymax = ucl), alpha = 0.2, fill = "darkorange") +
    geom_line(color = "darkorange", linewidth = 1) +
    geom_hline(yintercept = 1, linetype = "dashed", color = "grey50") +
    geom_vline(xintercept = ref_x, linetype = "dotted", color = "grey40") +
    labs(x = x_lab,
         y = "subHR (95% CI)",
         title = outcome_label,
         subtitle = subtitle_str) +
    scale_x_continuous(breaks = seq(-100, 100, 10)) +
    coord_cartesian(xlim = xlim, ylim = c(0, 4)) +
    theme_minimal(base_size = 14) +
    theme(plot.subtitle = element_text(size = 10, color = "grey25")) -> p
  .save_plot_pptx(p)
  p
}

5.1 Anemia Grade 2

Code
plot_subhr_linear_diff("cmp_time_anemia_2", "cmp_status_anemia_2",
                       "pre_HGB_45days", "Anemia Grade 2 (Carboplatin)")

5.2 Anemia Grade 3

Code
plot_subhr_linear_diff("cmp_time_anemia_3", "cmp_status_anemia_3",
                       "pre_HGB_45days", "Anemia Grade 3 (Carboplatin)")

5.3 Thrombocytopenia Grade 2

Code
plot_subhr_linear_diff("cmp_time_throm_2", "cmp_status_throm_2",
                       "pre_PLT_45days", "Thrombocytopenia Grade 2 (Carboplatin)")

5.4 Thrombocytopenia Grade 3

Code
plot_subhr_linear_diff("cmp_time_throm_3", "cmp_status_throm_3",
                       "pre_PLT_45days", "Thrombocytopenia Grade 3 (Carboplatin)")

5.5 AKI Grade 2

Code
plot_subhr_linear_diff("cmp_time_aki_2", "cmp_status_aki_2",
                       NULL, "AKI Grade 2 (Carboplatin)")

5.6 AKI (KDIGO)

Code
plot_subhr_linear_diff("cmp_time_aki_kdigo", "cmp_status_aki_kdigo",
                       NULL, "AKI (KDIGO) (Carboplatin)")

5.7 Composite Grade 2 AEs

Code
plot_subhr_linear_diff("cmp_time_grade_2_aes", "cmp_status_grade_2_aes",
                       c("pre_HGB_45days", "pre_PLT_45days"),
                       "Composite Grade 2 AEs (Carboplatin)")

5.8 Composite Grade 3 AEs

Code
plot_subhr_linear_diff("cmp_time_grade_3_aes", "cmp_status_grade_3_aes",
                       c("pre_HGB_45days", "pre_PLT_45days"),
                       "Composite Grade 3 AEs (Carboplatin)")

5.9 Overall Hospitalization

Code
plot_subhr_linear_diff("cmp_time_any_hosp", "cmp_status_any_hosp",
                       NULL, "Overall Hospitalization (Carboplatin)")

7 Dose Discrepancy (%) — Administered vs eGFRCR-CYS-Predicted Dose

Carboplatin dose discrepancy expressed as a percent of the eGFRCR-CYS-predicted dose:

\[ \text{Dose discrepancy (\%)} \;=\; \frac{\text{Dose}_{\text{administered}} - \text{Dose}_{\text{CR-CYS predicted}}}{\text{Dose}_{\text{CR-CYS predicted}}} \times 100 \]

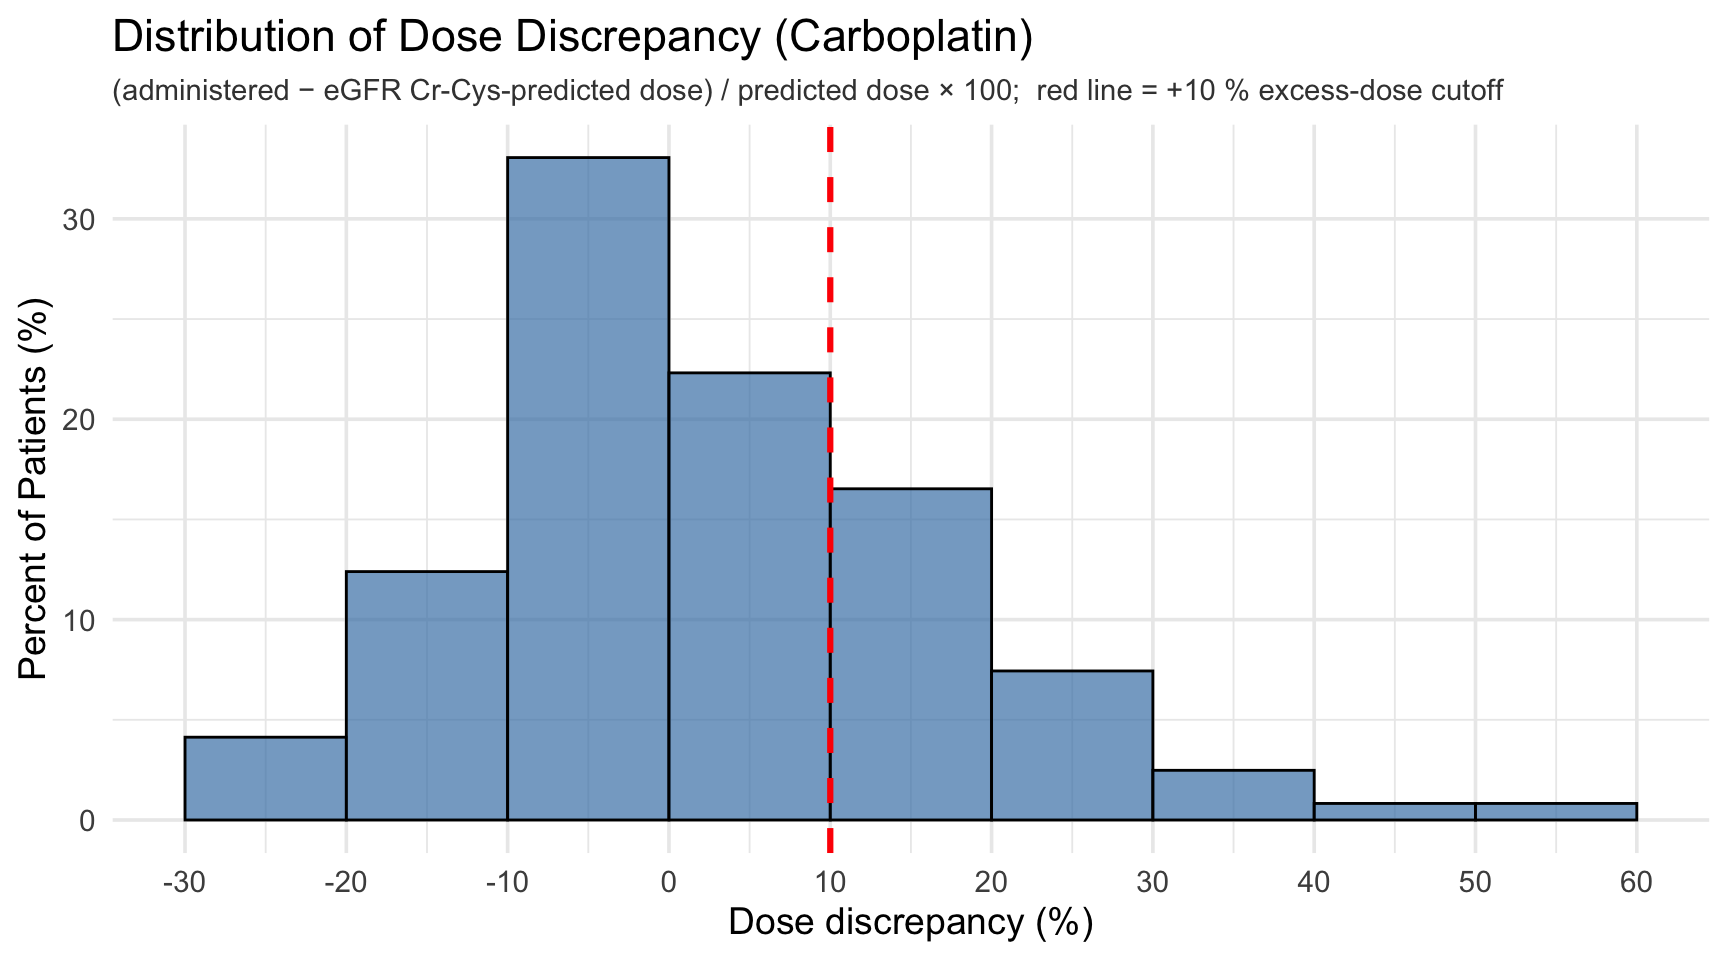
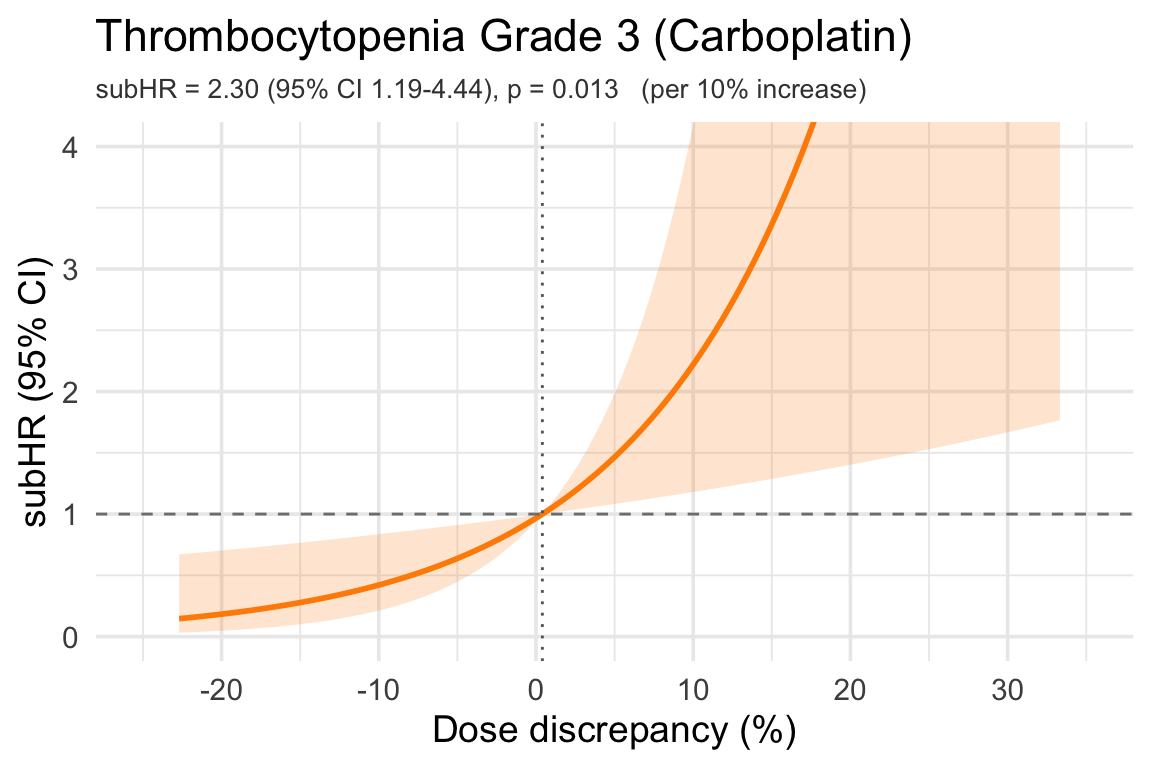
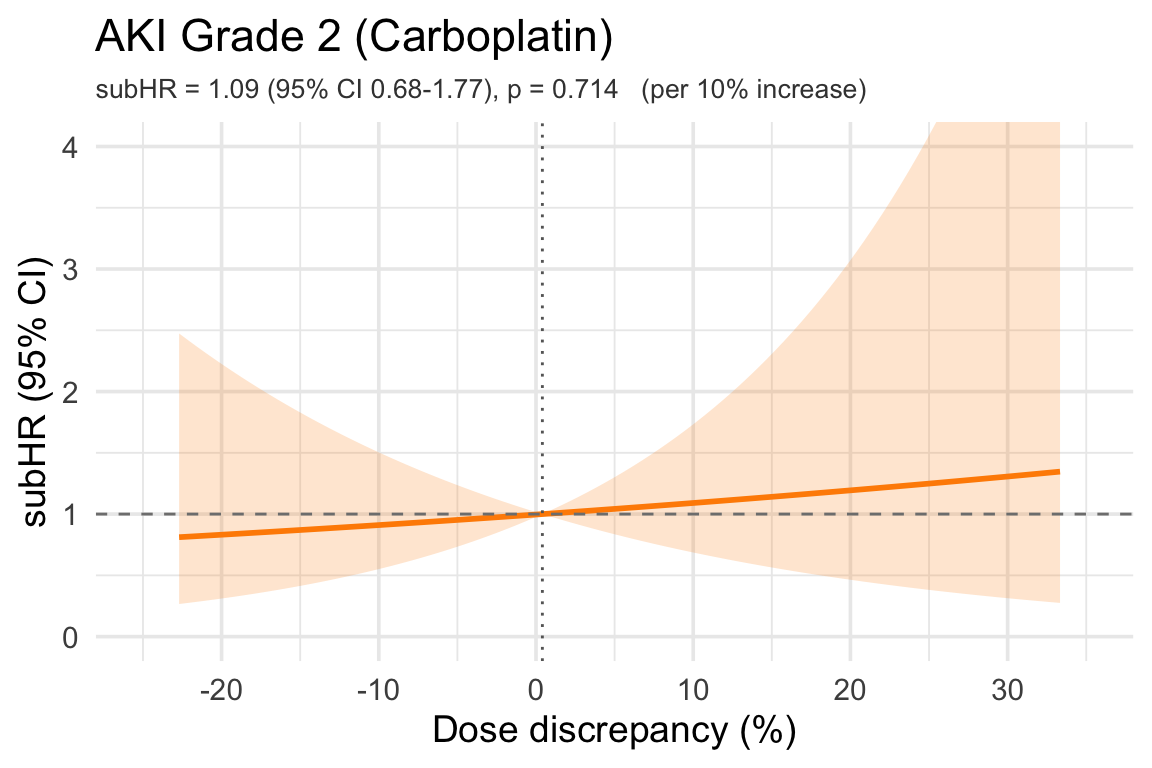
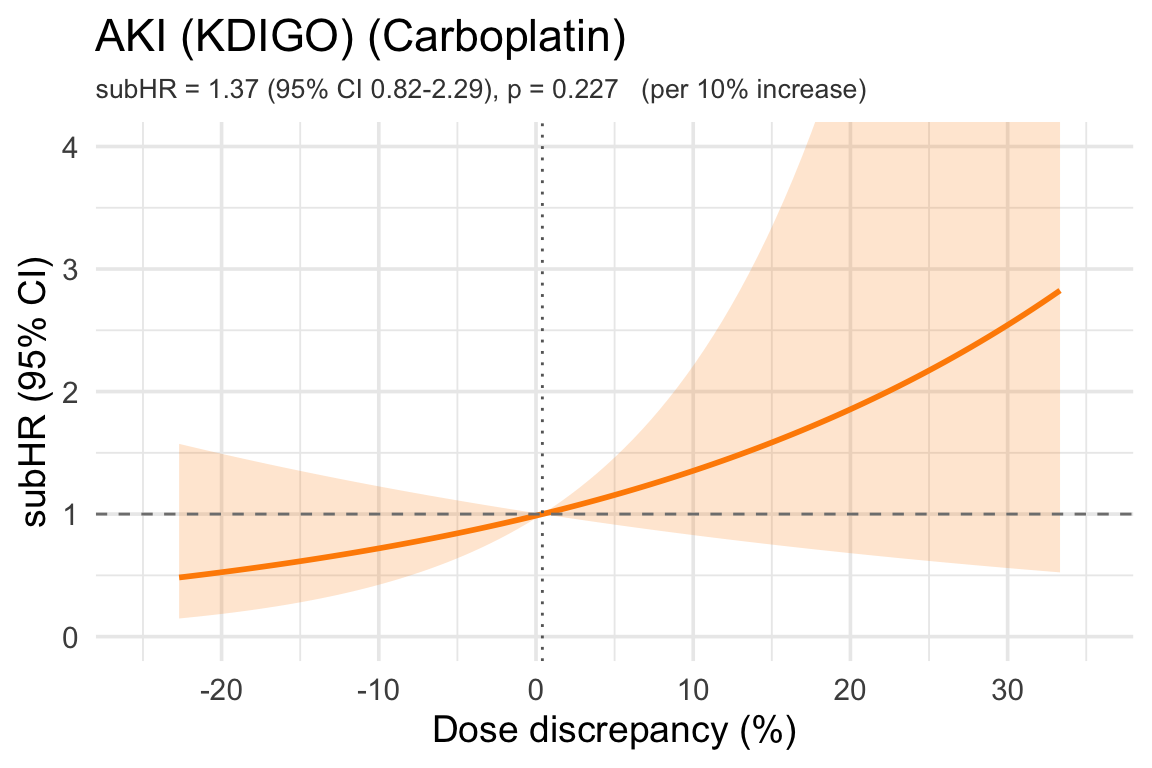
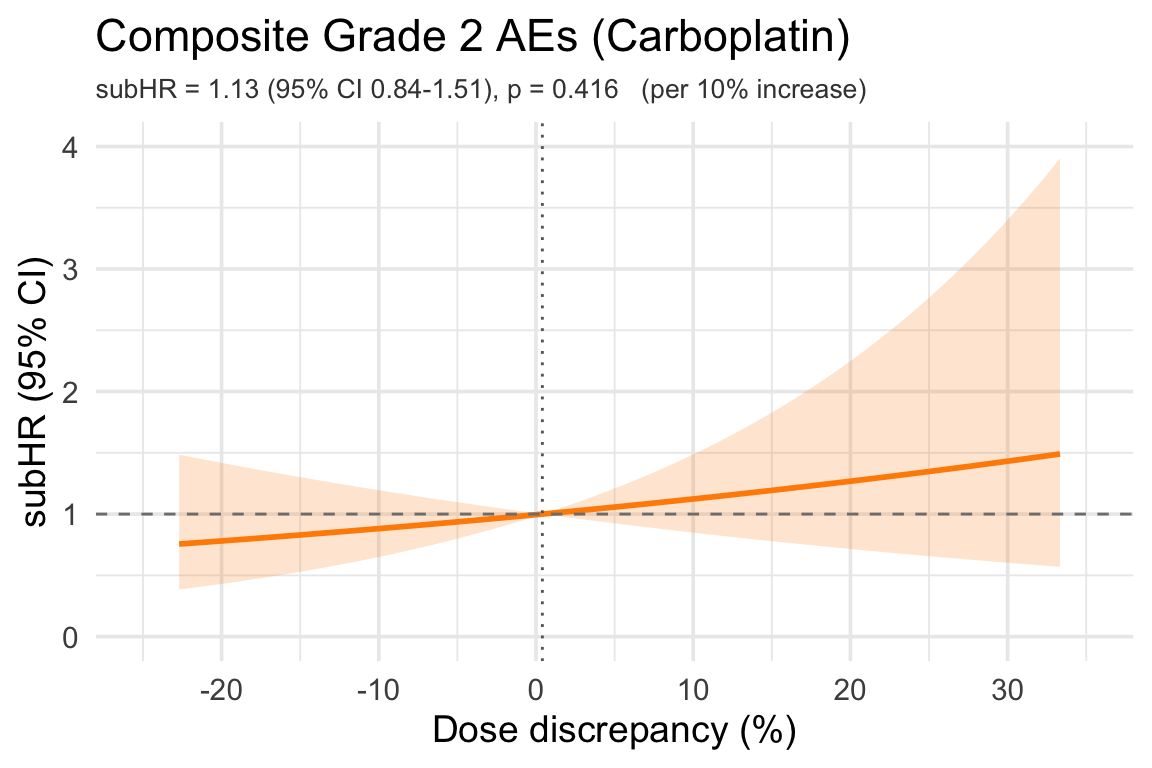
The predicted dose is the Calvert dose at the patient’s own target AUC from the BSA-adjusted CKD-EPI Cr-Cys eGFR (mL/min), capped at 125 mL/min: AUC × (min(eGFR, 125) + 25) — the same carbo_dose_cre_cys used on the Sherley Carboplatin Cohort page (pipeline variable dose_diff_pct). A positive value means the administered dose was higher than predicted, a negative value lower; for example 550 mg administered versus 500 mg predicted is a +10 % discrepancy. This is the percent analogue of the Sherley paper’s excess-dose definition (≥ 25 mg above the predicted dose): here an excess dose is one ≥ 10 % above the eGFRCR-CYS-predicted dose.

7.1 Distribution

Bins are 10 % wide with an axis tick at every bin edge. The red dashed line marks +10 %, the excess-dose cutoff.

Code
dose_hist <- dat %>% filter(!is.na(dose_diff_pct))

ggplot(dose_hist, aes(x = dose_diff_pct)) +
  geom_histogram(aes(y = after_stat(count) / sum(after_stat(count)) * 100),
                 binwidth = 10, boundary = 0,
                 fill = "steelblue", color = "black", alpha = 0.7) +
  geom_vline(xintercept = 10, linetype = "dashed", color = "red",
             linewidth = 1.1) +
  labs(title = "Distribution of Dose Discrepancy (Carboplatin)",
       subtitle = "(administered − eGFR Cr-Cys-predicted dose) / predicted dose × 100;  red line = +10 % excess-dose cutoff",
       x = "Dose discrepancy (%)",
       y = "Percent of Patients (%)") +
  scale_x_continuous(breaks = seq(-100, 200, 10)) +
  theme_minimal(base_size = 14) +
  theme(plot.subtitle = element_text(size = 11, color = "grey25")) -> p
.save_plot_pptx(p)
p
Code
qd <- quantile(dose_hist$dose_diff_pct, c(0.025, 0.25, 0.5, 0.75, 0.975))
n_dd         <- nrow(dose_hist)
n_excess10   <- sum(dose_hist$dose_diff_pct >= 10)
pct_excess10 <- 100 * n_excess10 / n_dd
n_under10    <- sum(dose_hist$dose_diff_pct <= -10)
n_within10   <- sum(abs(dose_hist$dose_diff_pct) < 10)
n_overlap    <- sum(dose_hist$dose_diff_pct >= 10 &
                      dose_hist$egfr_difference < -10, na.rm = TRUE)
r_dd_egfr    <- cor(dose_hist$dose_diff_pct, dose_hist$egfr_difference,
                    use = "complete.obs")

tibble::tibble(
  Statistic = c("N", "Median", "IQR (p25, p75)", "2.5th pct", "97.5th pct",
                "Excess dose: ≥ 10 % above predicted",
                "≥ 10 % below predicted",
                "Within ±10 % of predicted"),
  Value = c(
    as.character(n_dd),
    sprintf("%+.1f%%", qd[["50%"]]),
    sprintf("%+.1f%%, %+.1f%%", qd[["25%"]], qd[["75%"]]),
    sprintf("%+.1f%%", qd[["2.5%"]]),
    sprintf("%+.1f%%", qd[["97.5%"]]),
    sprintf("%d (%.1f%%)", n_excess10, pct_excess10),
    sprintf("%d (%.1f%%)", n_under10, 100 * n_under10 / n_dd),
    sprintf("%d (%.1f%%)", n_within10, 100 * n_within10 / n_dd)
  )
) %>%
  knitr::kable(align = c("l", "r"),
               caption = "Dose discrepancy (%) — distribution summary (carboplatin cohort).")
Dose discrepancy (%) — distribution summary (carboplatin cohort).
Statistic Value
N 121
Median +0.4%
IQR (p25, p75) -6.8%, +11.4%
2.5th pct -22.7%
97.5th pct +33.3%
Excess dose: ≥ 10 % above predicted 34 (28.1%)
≥ 10 % below predicted 20 (16.5%)
Within ±10 % of predicted 67 (55.4%)

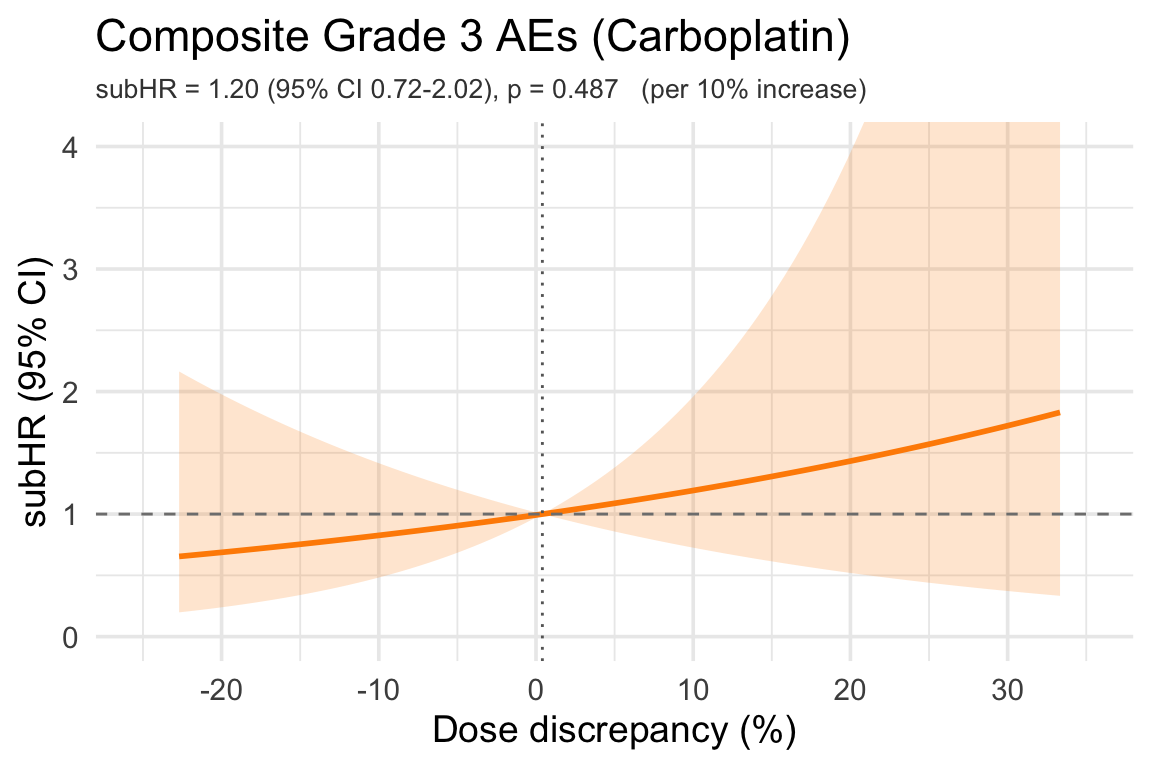
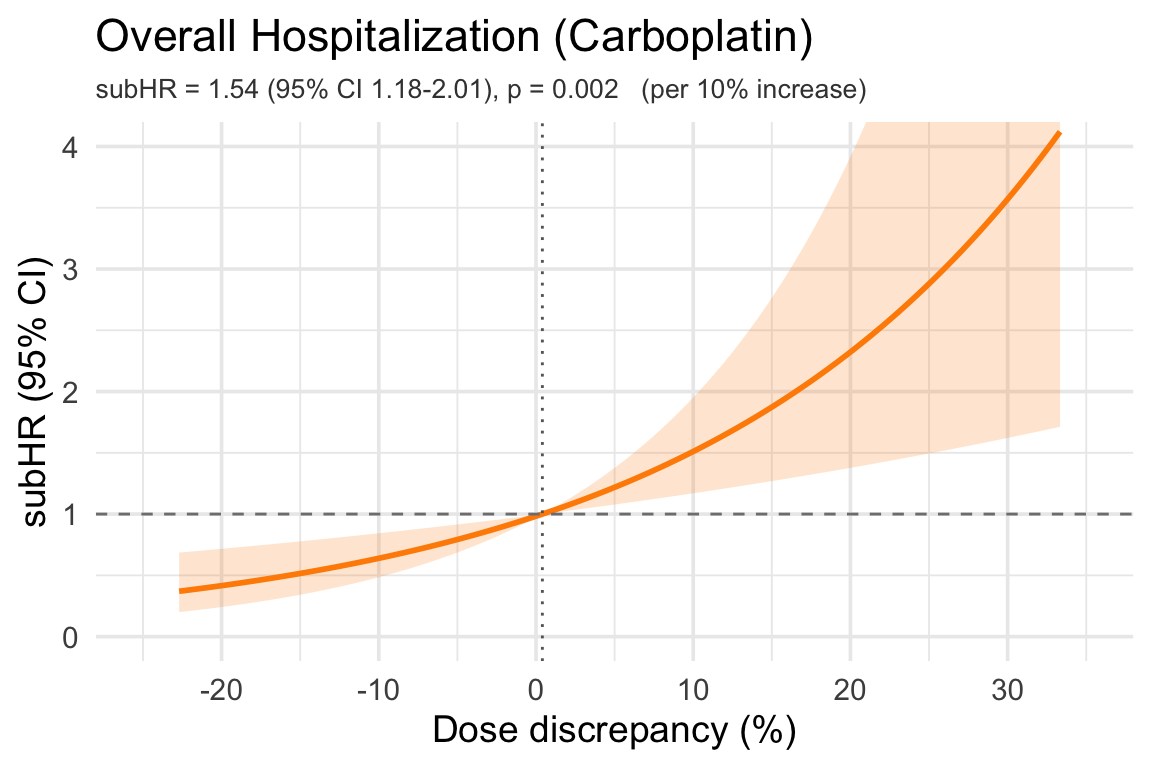
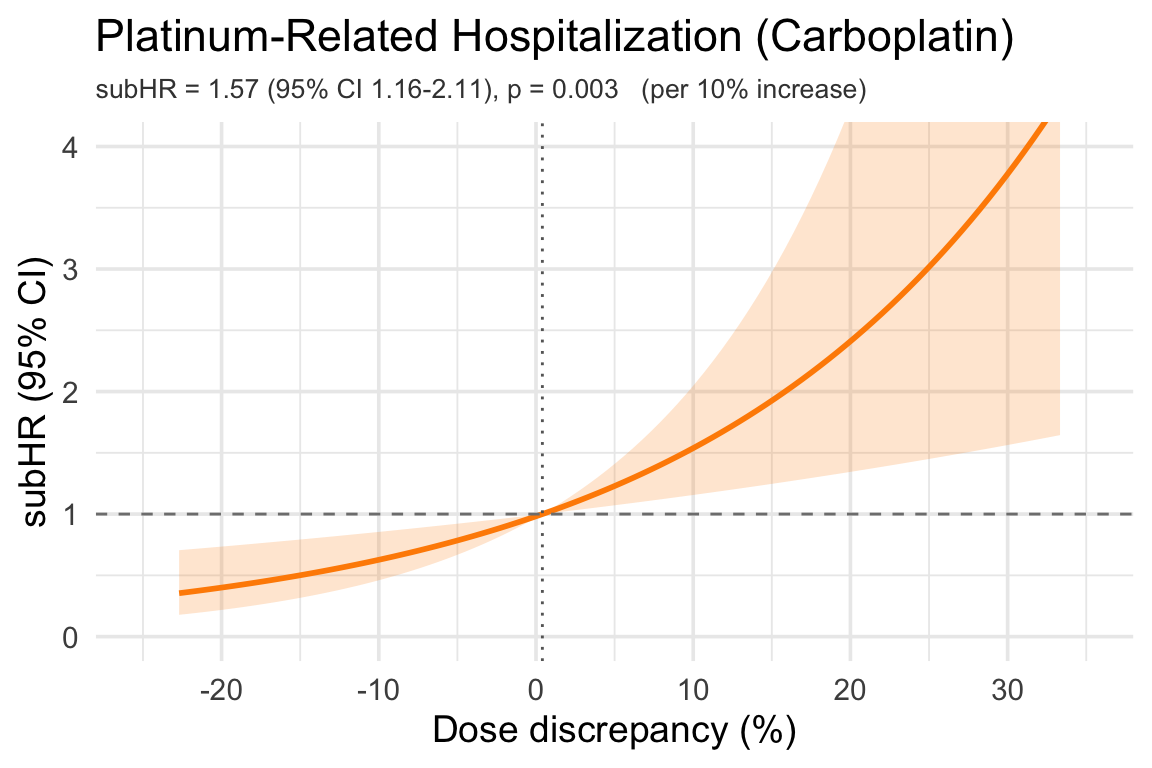
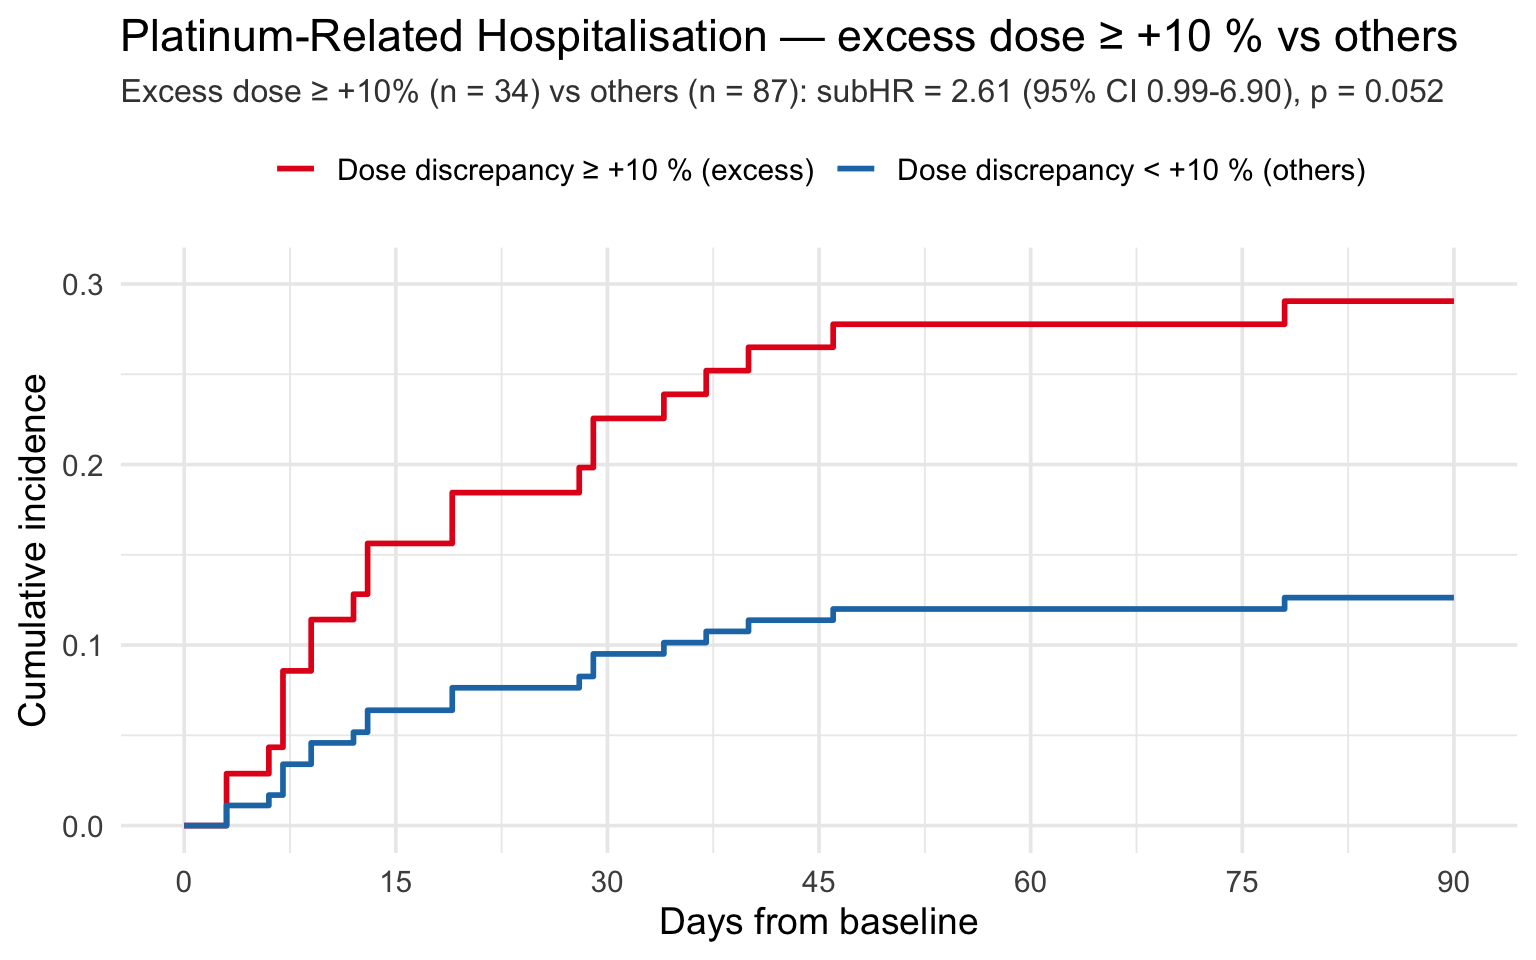
A total of 34 (28.1%) patients received an excess dose of carboplatin, defined as ≥ 10 % higher than the dose that would have been predicted using the CKD-EPI eGFRCR-CYS equation adjusted for actual BSA. (Denominator: 121 carboplatin patients with a computable predicted dose.)

All 34 of these patients also have an eGFR difference < −10 % (§3), and the two percentages are strongly inversely correlated (r = -0.93): administered doses closely track the Cockcroft-Gault-based dose (§4), so a CKD-EPI Cr-Cys eGFR well below Cockcroft-Gault shows up as an excess dose. The excess-dose group is therefore nearly a subset of the eGFR-difference randomization group, and §7.3 largely echoes §6.

7.2 Linear subHR Curves — Dose Discrepancy (%)

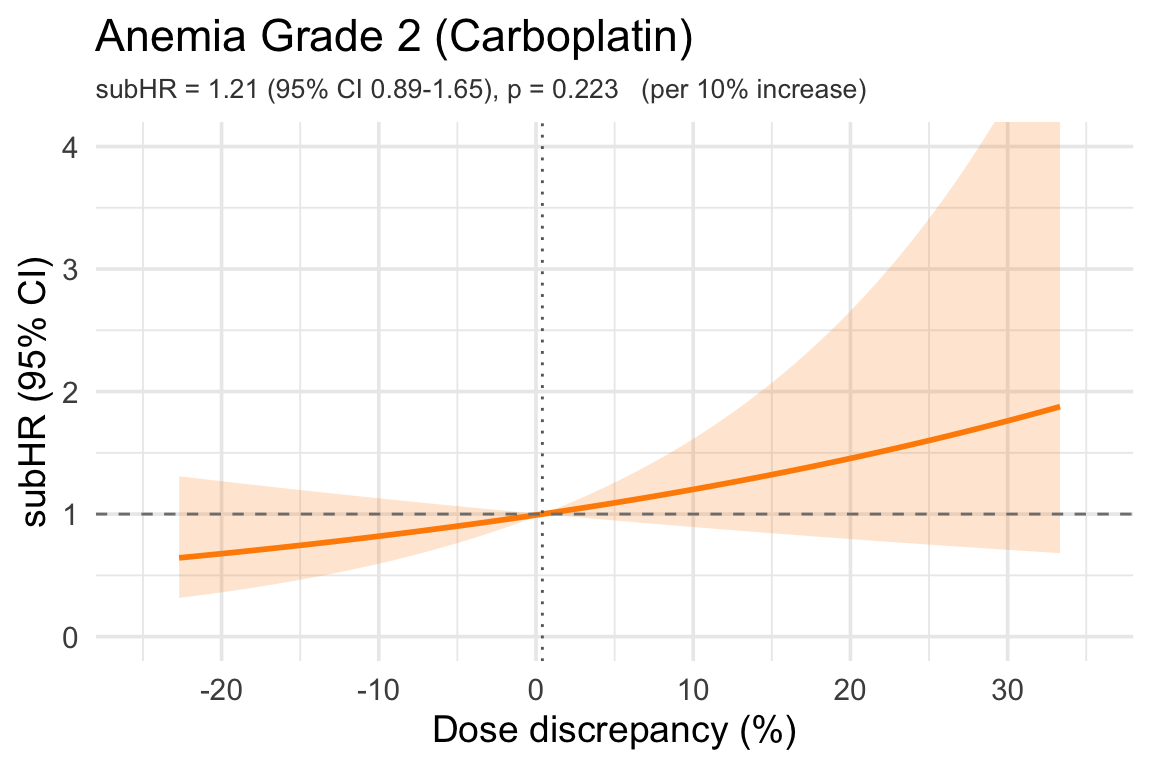
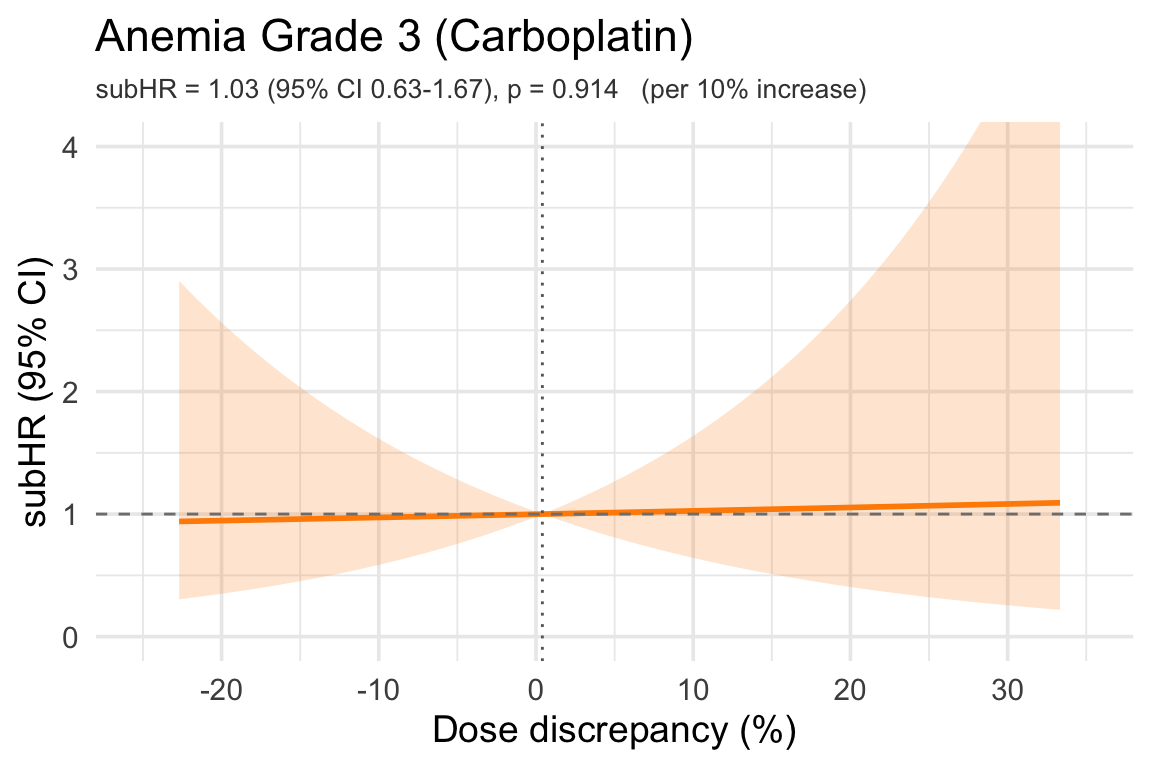
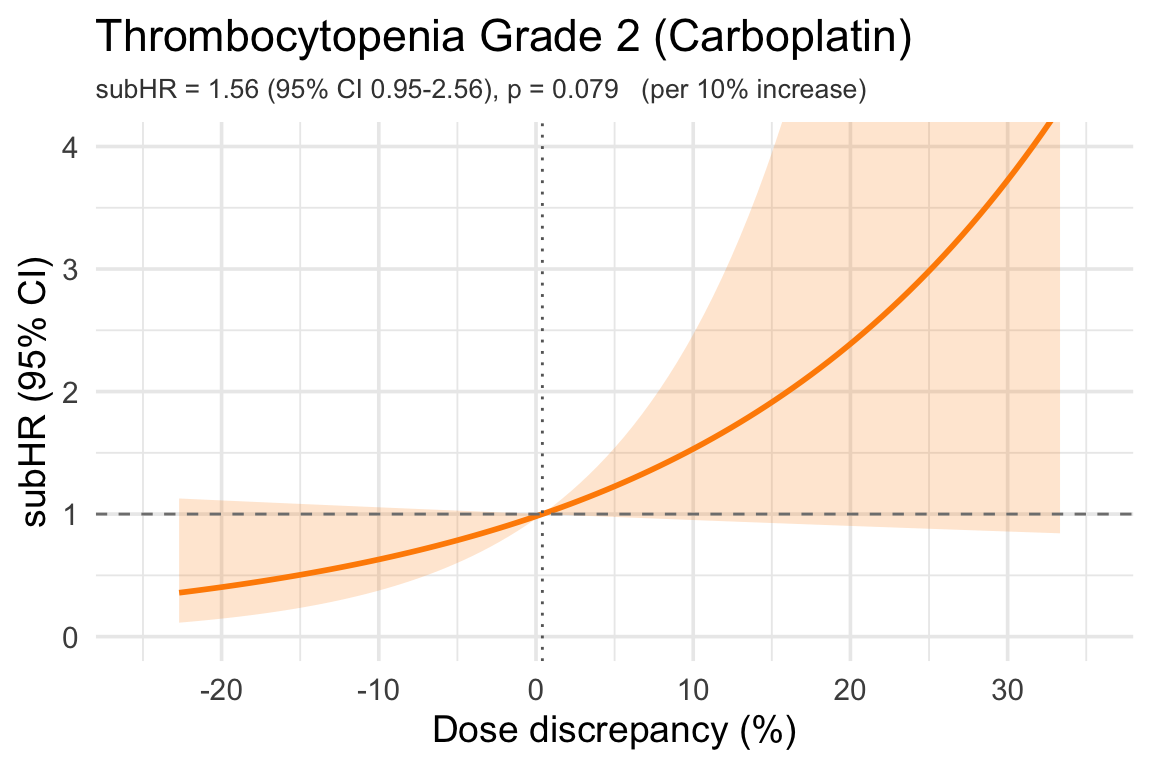
Same outcomes, adjusters and layout as §5, with the exposure being the dose discrepancy in percent. Reported subHRs are per 10 % increase in dose discrepancy (more drug given than eGFRCR-CYS predicts), so a subHR above 1 means a larger excess dose carries higher risk. Curves are relative to the cohort median (dotted vertical line) and trimmed to the 2.5th–97.5th percentiles.

Code
plot_subhr_dosepct <- function(time_var, status_var, extra_adj = NULL,
                               outcome_label) {
  plot_subhr_linear_diff(time_var, status_var, extra_adj, outcome_label,
                         x_var = "dose_diff_pct", scale = 10,
                         unit_label = "per 10% increase",
                         x_lab = "Dose discrepancy (%)",
                         xlim = c(-25, 35))
}

7.2.1 Anemia Grade 2

Code
plot_subhr_dosepct("cmp_time_anemia_2", "cmp_status_anemia_2",
                   "pre_HGB_45days", "Anemia Grade 2 (Carboplatin)")

7.2.2 Anemia Grade 3

Code
plot_subhr_dosepct("cmp_time_anemia_3", "cmp_status_anemia_3",
                   "pre_HGB_45days", "Anemia Grade 3 (Carboplatin)")

7.2.3 Thrombocytopenia Grade 2

Code
plot_subhr_dosepct("cmp_time_throm_2", "cmp_status_throm_2",
                   "pre_PLT_45days", "Thrombocytopenia Grade 2 (Carboplatin)")

7.2.4 Thrombocytopenia Grade 3

Code
plot_subhr_dosepct("cmp_time_throm_3", "cmp_status_throm_3",
                   "pre_PLT_45days", "Thrombocytopenia Grade 3 (Carboplatin)")

7.2.5 AKI Grade 2

Code
plot_subhr_dosepct("cmp_time_aki_2", "cmp_status_aki_2",
                   NULL, "AKI Grade 2 (Carboplatin)")

7.2.6 AKI (KDIGO)

Code
plot_subhr_dosepct("cmp_time_aki_kdigo", "cmp_status_aki_kdigo",
                   NULL, "AKI (KDIGO) (Carboplatin)")

7.2.7 Composite Grade 2 AEs

Code
plot_subhr_dosepct("cmp_time_grade_2_aes", "cmp_status_grade_2_aes",
                   c("pre_HGB_45days", "pre_PLT_45days"),
                   "Composite Grade 2 AEs (Carboplatin)")

7.2.8 Composite Grade 3 AEs

Code
plot_subhr_dosepct("cmp_time_grade_3_aes", "cmp_status_grade_3_aes",
                   c("pre_HGB_45days", "pre_PLT_45days"),
                   "Composite Grade 3 AEs (Carboplatin)")

7.2.9 Overall Hospitalization

Code
plot_subhr_dosepct("cmp_time_any_hosp", "cmp_status_any_hosp",
                   NULL, "Overall Hospitalization (Carboplatin)")

8 Downloadable PowerPoint Plots

Every figure on this page is also saved as an editable PowerPoint slide (vector graphics — text and shapes remain editable in PowerPoint). Click any link below to download the .pptx for that figure.

Code
pptx_files <- list.files(pptx_dir, pattern = "\\.pptx$", full.names = FALSE)
if (length(pptx_files) == 0) {
  cat("*No PowerPoint files were produced during this render.*\n")
} else {
  for (f in sort(pptx_files)) {
    label <- gsub("_", " ", tools::file_path_sans_ext(f))
    cat(sprintf("- [📥 %s](plots/grant/%s)\n", label, f))
  }
}